
Tech News
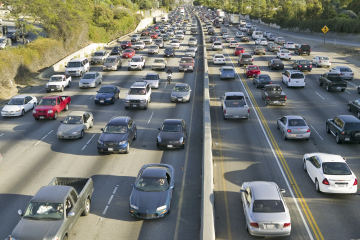
THE 10 NIGHTMARE CITIES WHERE NO ONE WANTS TO DRIVE

While a densely populated city can be congested, it can also make the city easier to walk around. According to Sivak’s report, walkability are among the factors that can influence households to avoid buying a vehicle. Walk Score constructed one measure of walkability by considering distance to amenities as well as pedestrian friendliness. Most of the cities where households were least likely to have a vehicle also had among the top 10 walk scores in the nation.
Based on an analysis of “Has Motorization in the U.S. Peaked?” from the University of Michigan Transportation Research Institute, 24/7 Wall St. identified the major U.S. cities where the fewest households had a vehicle in 2012. The report relied on figures originally produced by the U.S. Census Bureau’s American Community Survey. Also from the survey, we considered household vehicle figures for 2007, as well as commuting data from 2012. We also reviewed Census data on population, using July 2012 figures, as well as population-weighted density, based on a 2010 Census Special Report “Patterns of Metropolitan and Micropolitan Population Change: 2000 to 2010.” We used qualitative scores on the quality of walking, public transportation, and biking in cities from Walk Score, and figures from the Brookings Institution on transit coverage by metro area for 2010. Brookings considers anyone living within 3/4ths of a mile from a transit stop to be “served.”
These are the cities where no one wants to drive:
1. New York, N.Y.
> Pct. of households without a vehicle: 56.5%
> Pct. commuting to work via public transportation: 55.9% (the most)
> Transit score: 81.2 (the best)
> Population: 8,336,697 (the largest)
Nearly 90% of New York metro area residents were served by public transportation, more than all but a handful of other places in the U.S. More than 56% of New York City households did not own a car, the most of any city in the nation. This figure was up from 2007, when 54% of New York households did not have a car. In all, New Yorkers were more likely than residents of any other city to take public transportation to work, and no city received higher scores for walkability or transit. The city continues to invest in public transportation, including extensions to the city’s subway system, a new subway transit hub in downtown Manhattan, and improving accessibility for Long Island Rail Road commuters.
2. Washington, D.C.
> Pct. of households without a vehicle: 37.9%
> Pct. commuting to work via public transportation: 38.6% (4th most)
> Transit score: 70.4 (4th best)
> Population: 619,020 (24th largest)
Nearly 38% of households in Washington, D.C. did not have a car in 2012, one of the highest percentages in the U.S. Additionally, more than 60% of working residents chose not to drive to work, one of the highest rates in the nation. The city received some of the highest marks from Walk Score for walkability, public transit, and biking in the area. As of 2010, 82.5% of the Washington, D.C. metro area’s population was served by a transit system. This figure may rise once the first section of the Washington Metro’s Silver Line opens, scheduled for later this year.
3. Boston, MA
> Pct. of households without a vehicle: 36.9%
> Pct. commuting to work via public transportation: 34.6% (5th most)
> Transit score: 74.8 (3rd best)
> Population: 628,335 (21st largest)
Boston commuters were more likely to walk to work than those in any other major city. More than 15% did so in 2012. The city’s public transportation also offers excellent alternatives to driving, according to Walk Score, which rated Boston’s transportation infrastructure third best in the country. The Massachusetts Bay Transportation Authority (MBTA), also known as the T, recently announced the completion of train arrival information systems at all 53 of its heavy rail stations in the city, one of the first cities in the country to do so.
4. Philadelphia, PA
> Pct. of households without a vehicle: 32.6%
> Pct. commuting to work via public transportation: 26.0% (12th most)
> Transit score: 67.0 (5th best)
> Population: 1,538,567 (5th largest)
The Southeastern Pennsylvania Transportation Authority (SEPTA) maintains rail, trolley, and bus routes throughout the Philadelphia region, including more than 100 bus stations. There are four public transit systems in addition to SEPTA connecting residents to their destinations in the Philadelphia metro area. The city was among the top six urban areas for its walkability, overall transit quality, and bikeability.
5. San Francisco, CA
> Pct. of households without a vehicle: 31.4%
> Pct. commuting to work via public transportation: 33.1% (6th most)
> Transit score: 80.5 (2nd best)
> Population: 814,233 (14th largest)
San Francisco’s transit system was rated higher than all but one other city by Walk Score. The city also scored higher than nearly all other urban areas for its biking and for its walkability. City residents were taking advantage of these opportunities as of 2012, with over 55% choosing not to commuting to work by car, more than all but a handful of U.S. cities. San Francisco, which is well within commuting distance of Silicon Valley, also pioneered a controversial program permitting companies such as Google and Apple to use public bus stops for their private shuttles.
source:http://business.time.com/2014/02/08/the-10-nightmare-cities-where-no-one-wants-to-drive/